Space utilization analytics is the practice of measuring how spaces are used compared with their capacity over time. Analyzing space utilization metrics by room type gives a more accurate picture than a building average, which can hide both shortages and surplus.
Consider a building that reports healthy average utilization. Its small meeting rooms are booked solid, yet its large conference rooms sit mostly empty. The average utilization looks fine, but the teams that need a place to meet still seem to struggle to find one. This article shows how to read utilization room type by room type and how to act on the gaps.
Why building averages hide room-level problems
Each room type serves a different purpose, so blending them into one figure masks both shortages and surplus. A private office, a meeting room and a lab each need their own measure of what healthy use looks like.
It helps to separate two terms: Occupancy tells you whether a space is in use and how many people are in it. Utilization compares that use with capacity over time. Many campus planners break utilization into two parts: Frequency, or how often a room is in use during its available hours, and seat fill, or how many seats are taken when it is in use. For basic definitions of each metric, read our guide to space utilization.
Space utilization metrics that matter for each room type
The right metric depends on what a room is for. For each room type below, we cover what to measure, what a problem looks like and one possible action.
Assigned desks and private offices
Measure how many days each week someone uses the space. A desk or office that sits empty on most days is a sign of low utilization, and consistently low use can support a move to shared seating. A practical next step is to convert a group of underused assigned desks into shared desks and track whether use holds up.
Shared desks and collaboration spaces
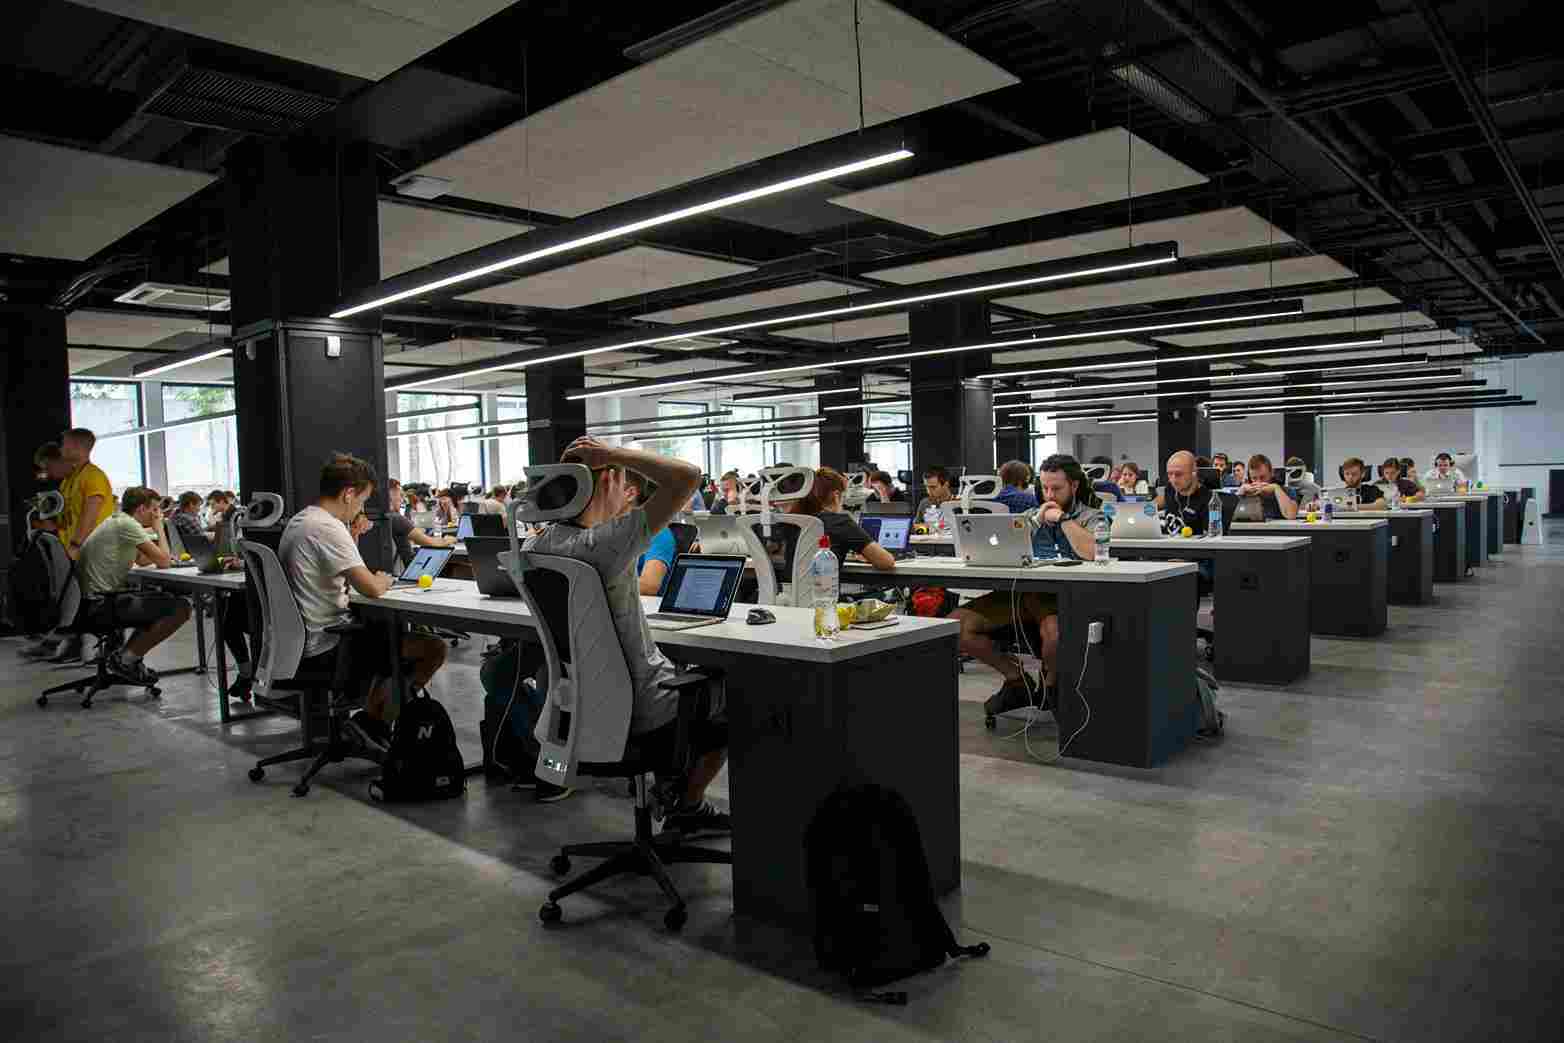
Measure peak-day occupancy rather than the weekly average, because shortages happen on the busiest days. A shared area can look comfortable on average and still run out of seats on its busiest day. One possible action is to set the number of shared seats based on peak demand, then measure again.
Meeting and conference rooms
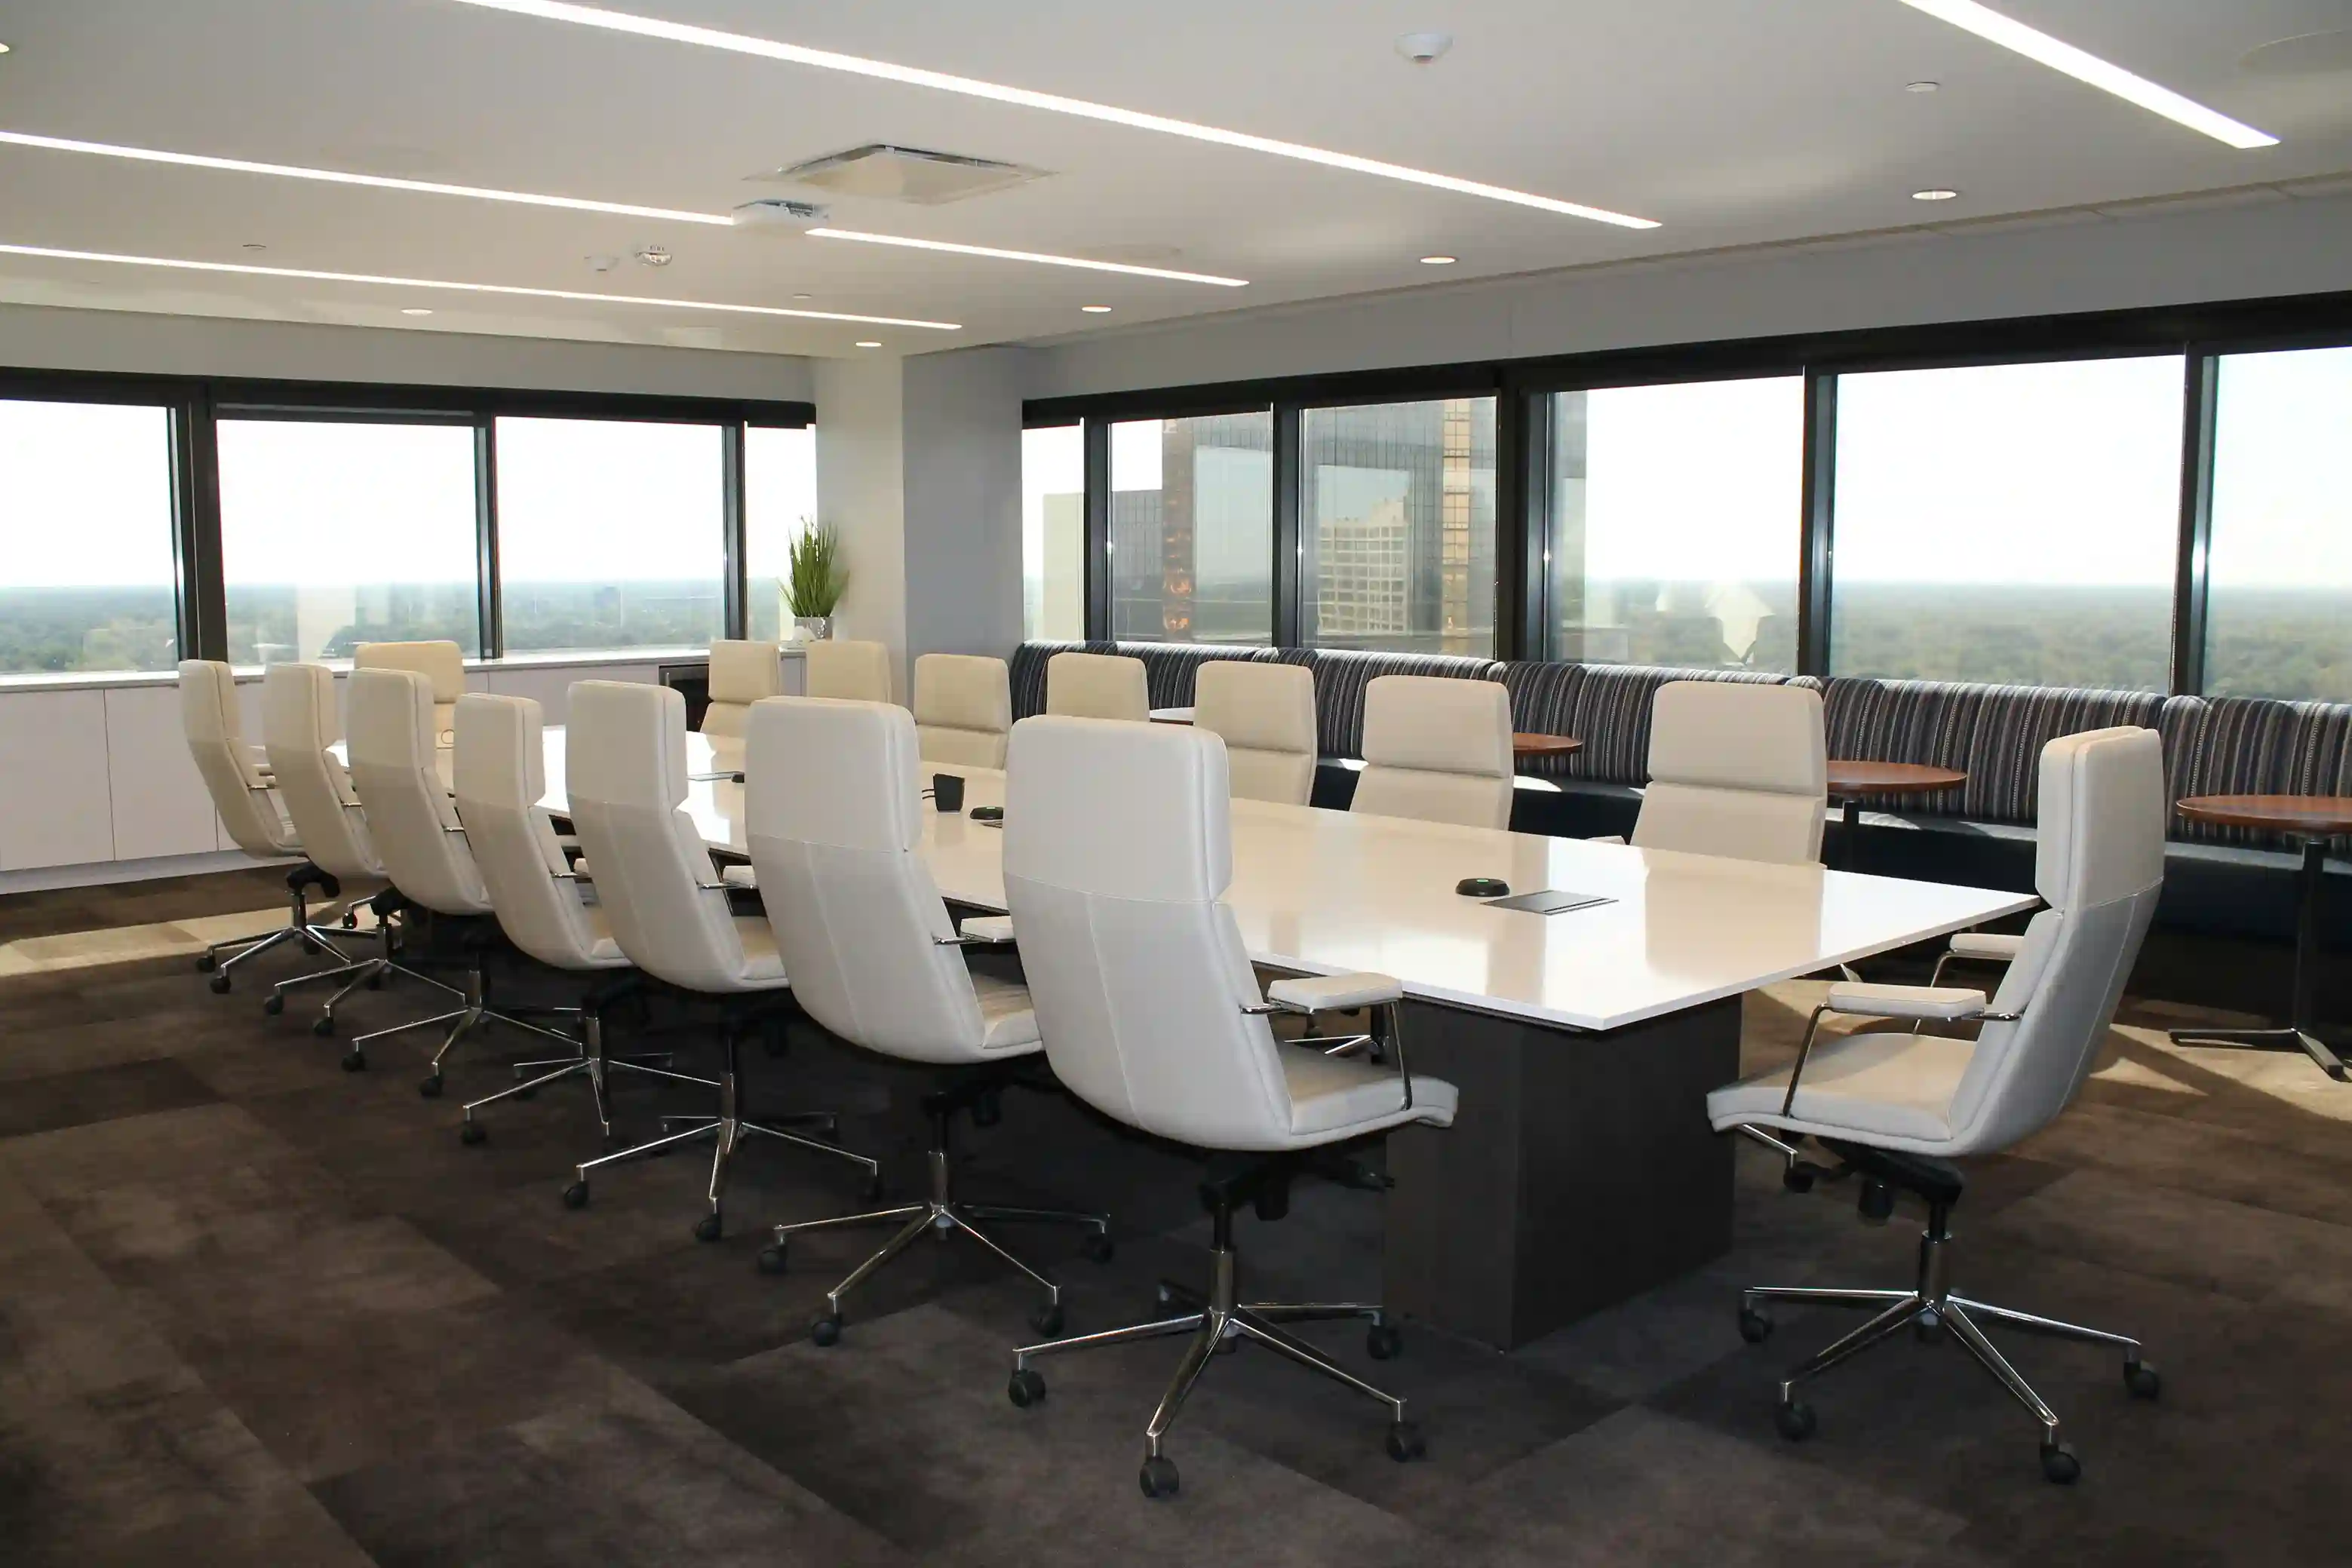
Measure frequency and seat fill together. A room that is booked all day but is rarely close to full is the wrong size. Look for patterns, such as a large conference room that regularly hosts meetings of only three or four people. One possible action is to convert an oversized conference room into two smaller rooms.
Classrooms
Measure scheduled hours against available hours, and enrollment against seats. A classroom that is scheduled for many hours but regularly holds a small class in a large room points to a mismatch between section size and room size. Many institutions classify rooms using the Postsecondary Education Facilities Inventory and Classification Manual (FICM) from the National Center for Education Statistics, which groups rooms into categories such as classrooms, laboratories and offices. Seat fill also varies with room size, and Cornell University notes that smaller rooms can reasonably run at a higher seat fill, so compare rooms of similar size. One possible action is to move small sections into smaller rooms and free the larger ones for bigger classes.
Labs and specialized spaces
Lower frequency can be normal for specialized rooms, so compare labs with other labs rather than with classrooms. The FICM treats laboratories as their own category, separate from classrooms. Accurate room-level data also supports reporting for grants and chargebacks. One possible action is to review labs that fall well below comparable labs before reassigning any space.
How to turn room-type data into decisions
Space utilization metrics help only when they lead to a decision. These five steps turn room-type data into action:
- Confirm each room has a consistent type and capacity. Check your space inventory first, because you can compare results only when every room uses the same classification. Fix mismatched types and missing capacities before drawing any conclusions.
- Compare each room with others of the same type. A lab belongs next to other labs, not next to classrooms or offices. A meeting room that looks quiet beside a classroom may still be the busiest room of its kind.
- Look at peak days and time blocks, not only averages. Shortages and surplus show up in the busiest and quietest periods. A room that averages well can still be full during its busiest time block.
- Flag outliers for resizing, conversion or restacking. Rooms far above or below their peers are the strongest candidates for a change. Pair each flagged room with an owner and a next step so the finding turns into a decision.
- Measure again after each change. A follow-up measurement shows whether the change solved the problem.
For a closer look at the data behind these steps, read our post on real-time space analytics for smarter workspaces.
How Accruent EMS shows utilization by room type
Accruent EMS is the Accruent workplace and campus space management platform. It manages desks, rooms, events and other shared resources in one platform, so the booking activity behind these metrics lives in one place. That makes it a practical way to see how each room type performs. EMS supports the steps above in several ways:
- Track offices, conference rooms, classrooms, labs and common areas in one platform
- Report on usage, cancellations, meeting type and service changes
- Spot underutilized space, including departmentally owned campus space
- Build and share custom reports with the query builder or start from 100+ standard reports
- Email reports automatically to chosen recipients on a set schedule
For booking data, EMS tracks metrics such as usage and cancellations. Campus teams can use EMS for centralized scheduling and classroom and campus space reporting, while corporate teams can use it for desk and room reservations.
See every room type clearly with Accruent
Space decisions are only as reliable as the detail in the data behind them. A building average shows how a facility performs overall, but room-type metrics show where space is working and where underutilized space is hiding. With that detail, you can resize, convert or restack based on evidence rather than assumptions. EMS gives facility and workplace teams one place to schedule rooms and desks and report on how each one is used, which helps when a restack, a lease decision or a budget cycle is on the calendar.
Book a demo of Accruent EMS to see how you can optimize your facility space.